If you’re not sure why you should invest in social media campaigns, well just wait. We are going to break down just 10 reasons why and should help you make the decision.
If you’re trying to decide where to concentrate your social ad spend in the new year, you have come to the right place. Social ads are not just for experts and consultants anymore, and almost no one is getting by on organic alone nowadays. Use these 10 stats to get caught up on the trends and reasons why people and companies use paid to bump up their ROI.
Let’s DIVE IN –
General Social Media Advertising Statistics
- Social ad spending is forecasted to increase by 16.9% to nearly $51 BILLION alone in 2021.
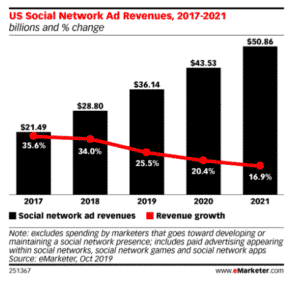
- As of late 2019, the worldwide average CPM is down 3% year over year.
Or, in regular human English: The average price that a brand pays for an ad to be seen by 1,000 people on social media was about $5.35 USD in late 2019. This is down from $5.53 in late 2018. Meaning it’s getting cheaper to be seen.
- Social ad impressions are up 20%, year over year.
According to Statista, more people are seeing ads. Statista suggests that this is because of the rise of video and story format ads, which generally do well with attracting impressions and engagement.
- Average global social CTRs are down 30%, year over year.
On the other hand, people are clicking less. Social click through rates went from 2.6% to 2% in late 2019.
- 52% of all online brand discovery still happens in public social feeds.
Yes, Mark Zuckerberg says “the future is private,” but public feeds aren’t in the grave by a long shot.
- Weak Social Ads create a negative emotional response in less than a second.
By the time your viewer blinks, they’ve given your ad a pass or a fail. In other words, don’t rely on cash to make up for quality. If you don’t want to be just another annoying brand ruining Instagram, you need high-quality copy, CTAs, and visuals.
B2B Ad Statistics
- 72% of B2B marketers who use paid channels online use paid social.
Over the B2B side of things, marketers are generally convinced of social’s usefulness in their ad strategies.
- 27% of internet users say they find new products and brands through paid social ads.
Back to the B2B side: paid social ads are the #4-way people find new products, period. Like, in life, not just online. Social ads are the runner-up after word-of-mouth, Tv ads, and search engines, in that order.
- 13% of internet users say that a “buy” button would increase their likelihood of purchasing on social. This is not an impressive number. I mean, if you don’t have a buy button on your product posts, paid or organic, do take the time to add one. But it’s not a silver bullet. We will need to slay the werewolf of low conversions another way.
Instagram Ad Statistic
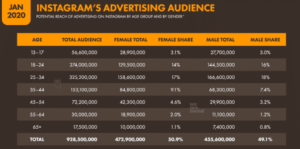
- 5 million people can be reached by ads on Instagram!
That’s a high percentage of the platform’s 1 billion-plus monthly active users.
We’re going to be dishing up more and more statistics over the year to help you understand the power of marketing BUT in the meantime, if you ever have questions about anything please feel free to reach out to our team! We are here to help and guide you along the way (=